
價格:免費
更新日期:2020-07-23
檔案大小:49.8 MB
目前版本:1.0.3
版本需求:系統需求:iOS 8.0 或以後版本。相容裝置:iPhone、iPad、iPod touch。
支援語言:英語
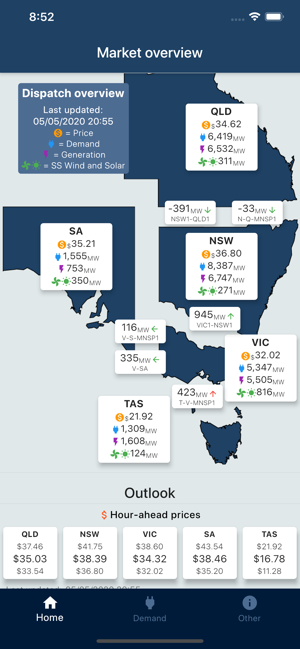
View data and information from the Australian National Electricity Market (NEM). With NEM Data you have instant access to information published by the Australian Energy Market Operator (AEMO) including wholesale electricity prices, regional demand and generation, and interconnector flows displayed on an easy-to-use map.
Features include:
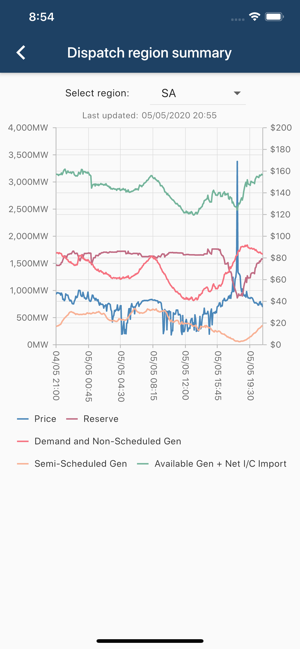
* A dispatch overview map showing regional energy price, demand and supply as well as interconnector flow. Each region can be tapped on to view the previous 24 hours dispatch prices, demand, available generation and interconnector imports, wind and solar generation, and reserve levels. Each interconnector can be tapped on to view the previous 24 hours interconnector flows, and import and export limits.
* An hour-ahead price outlook, displaying minimum, median and maximum dispatch prices for each region, sourced from the 5-minute pre-dispatch solution. Each region can be tapped on to view the 5-minute pre-dispatch forecasts of prices, demand, available generation and interconnector imports, wind and solar generation and reserve levels for the next hour. This is updated every 5-minutes and is available in the application as soon as it is published by AEMO.
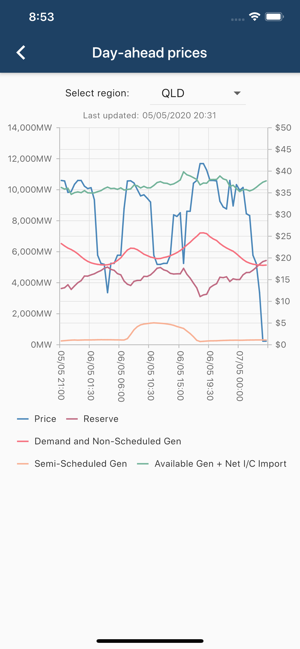
* A day-ahead price outlook, displaying minimum, median and maximum pre-dispatch prices for each region, sourced from the pre-dispatch solution. Each region can be tapped on to view the 30-minute pre-dispatch forecasts of prices, demand, available generation and interconner imports, wind and solar generation and reserve levels for the next trading day. This is updated every 30-minutes and is available in the application as soon as it is published by AEMO.
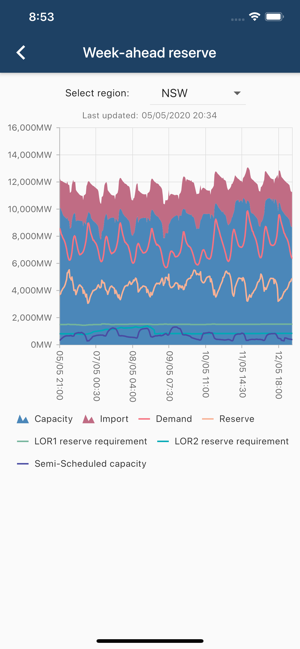
* A week-ahead reserve outlook, displaying a traffic light indication of reserve levels for each region, sourced from the Pre-Dispatch Projected Assessment of System Adequacy (PDPASA) and Short-Term Projected Assessment of System Adequacy (STPASA) processes. Each region can be tapped on to view the forecasts of demand, generation capacity, interconnector import capacity, wind and solar generation capacity, the Lack of Reserve level 1 (LOR1) reserve requirement (or trigger level), the Lack of Reserve level 2 (LOR2) reserve requirement (or trigger level) and reserve levels for the week ahead.
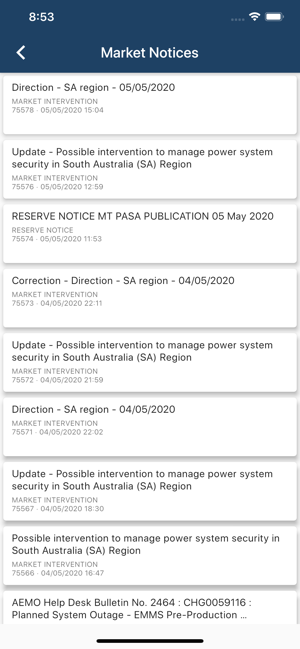
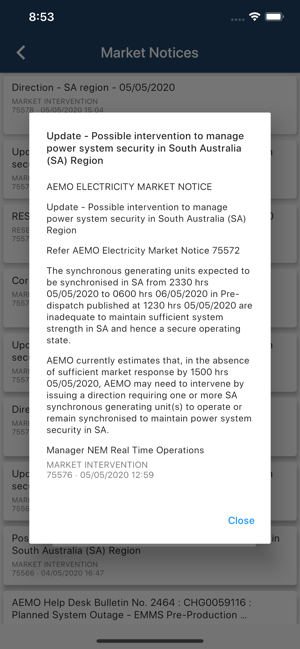
* A list of Market Notices issued by AEMO, with the market notice number, heading, type and date of publication visible. Each market notice can be tapped on to view the market notice detailed information.
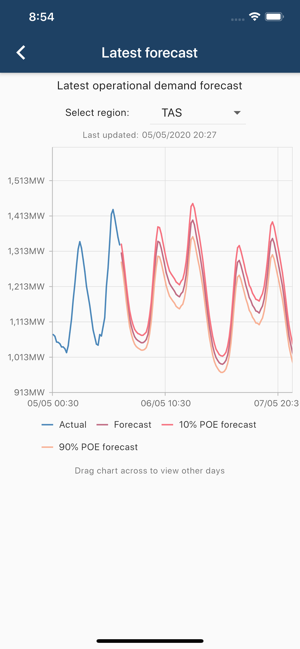
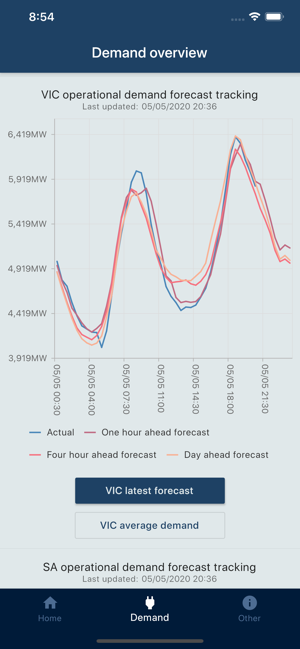
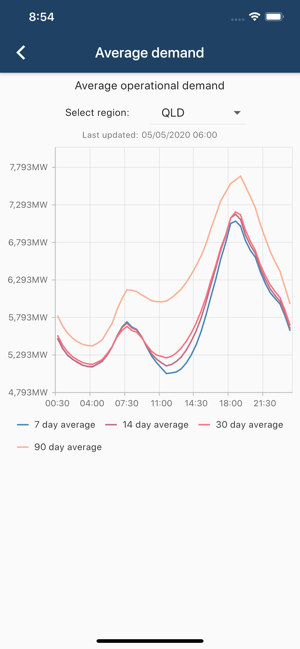
* A demand overview screen showing the regional operational demand and how it is tracking against the 1-hour ahead, 4-hour ahead and day-ahead demand forecasts. The latest demand forecasts for each region can also be viewed, which show the most recent demand forecast published by AEMO for the week ahead. There is also an average demand screen which shows the rolling 7-day, 14-day, 30-day and 90-day average demand for each region - useful for viewing how demand changes as the seasons progress.
* View summary statistics of the accuracy of the operational demand forecast issued by AEMO. The summary statistics show the errors of the load forecasts by region, historic period, forecast horizon and by interval. This can be used to compare the accuracy of the load forecasts for different regions and at different lead times.
This application is being actively developed so use the in-app functionality to submit feature requests to prioritise and view the next features being developed.